
An aim of the Digital Technologies in the Australian Curriculum is to for students to confidently use digital systems to efficiently and effectively automate the transformation of data into information and to creatively communicate ideas in a range of settings. The F-2 band description requires students to be able to describe how information systems meet information, communication and/or recreation needs.
Teachers need to develop student knowledge, understanding and skills of the way a computer works. The teacher needs to scaffold activities, demonstrate and support students to understand that working on a computer is the sending and receiving of information into and out of a computer. They help students to understand that the more efficient they are at sending and receiving information into and out of their computer, the more efficient and effective their computers will work.
Teachers need to develop student knowledge, understanding and skills of the way a computer works. The teacher needs to scaffold activities, demonstrate and support students to understand that working on a computer is the sending and receiving of information into and out of a computer. They help students to understand that the more efficient they are at sending and receiving information into and out of their computer, the more efficient and effective their computers will work.
Pixel is a word invented from "picture element". It is the basic unit of programmable color on a computer display or in a computer image. A pixel is a single element of an image. A pixel can be only one color. An image is made up of a grid of thousands of pixels, each of varying colors that together make up the image. You can see these pixels if you open a photo inside a photo editing program like Paint and enlarge the image until you see single blocks of color. Each block is a pixel. The image below left is 300x300 (90 000 pixels) ands the image on the right is 88x88 (7744 pixels) but has been enlarge to the same size as the image on the left to display pixels. This is known as pixilation.
|
|
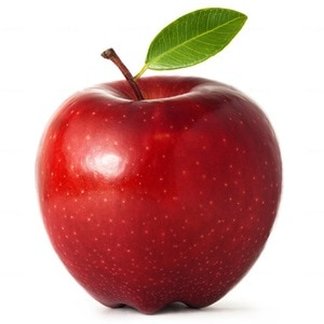
Below, the same two images are now set to the same resolution. While both look good now, what differs is the size at which the image is displayed. The smaller image only has enough pixels to display well at that size. The images have been resized so that the pixel resolution is 72 dpi to suit the monitor. Since the pixels are now set to the same resolution, it is the image, or document size, that shrinks or expands to fit. Both images now have the same resolution, it is now the image size of each that is clearly different.
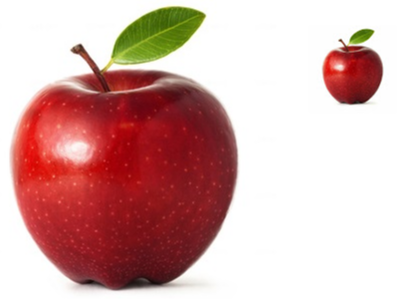
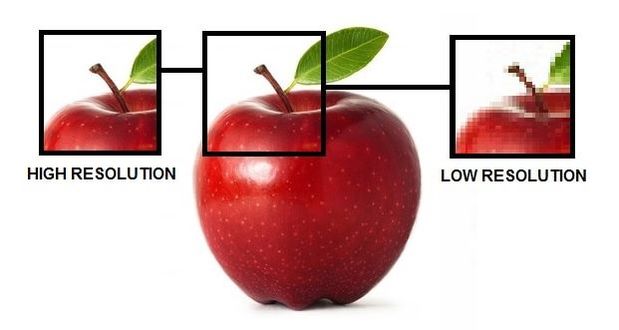
Image resolution is the detail an image holds and refers to the number of pixels in an image. To understand the difference between low resolution and high resolution images, the terms DPI (dots per inch) and PPI (pixels per inch) must be explored. Although DPI and PPI both describe resolution, clarity of an image, they are not the same thing. PPI describes the number of square pixels that show up in an inch of digital screen and DPI is a printing term referring to the number of physical dots of ink in a printed document. It makes sense that low resolution images are smaller file sizes than high resolution images; they have so much less digital information. This means they take up less space, load much quicker, and are easier to send through email. The image below shows a comparison of low resolution and high resolution of the same image.
A bit (short for binary digit) is the smallest unit of data on a computer. Each bit has a single value of either 1 or 0. A computer communicates and presents information using a binary system of digits consisting of a string of consecutive 0’s and 1’s. Ongoing strings of these bits become the code or data that is interpreted by a computer. Binary numbers look strange when they are written out directly. This is because the digits' weight increases by powers of 2, rather than powers of 10. In a digital numeral, the digit furthest to the right is the "ones" digit; the next digit to the left is the "twos" digit; next comes the "fours" digit, then the "eights" digit, then the "16s" digit, then the "32s" digit, and so on. The decimal equivalent of a binary number can be found by summing all the digits. For example, the binary 10101 is equivalent to the decimal 1 + 4 + 16 = 21:
DECIMAL = 21 64 32 16 8 4 2 1
BINARY = 10101 0 0 1 0 1 0 1
The specific color that a pixel describes is some blend of three components of the color spectrum – RGB (red, green, blue). Up to three bytes of data are allocated for specifying a pixel's color, one byte for each major color component. A true colour, or 24-bit color system uses all three bytes. However, many color display systems use only one byte, limiting the display to 256 different colors.
Each colour of an image is stored as a binary number and the colour depth of an image is measured in bits. The number of bits indicates how many colours are available for each pixel. In a black and white image, only two colours are needed. This means it has a colour depth of 1 bit. A 2-bit colour depth would allow four different values: 00, 01, 10, 11. This would allow for a range of colours such as:
Binary Code Colour
00 White
01 Light grey
10 Dark grey
11 Black
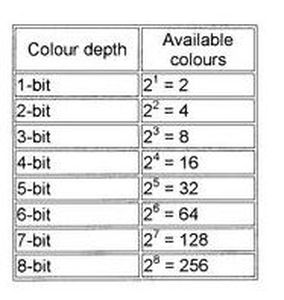
The greater the colour depth (bits per pixel), the more colours are available as shown in the table (right).
DECIMAL = 21 64 32 16 8 4 2 1
BINARY = 10101 0 0 1 0 1 0 1
The specific color that a pixel describes is some blend of three components of the color spectrum – RGB (red, green, blue). Up to three bytes of data are allocated for specifying a pixel's color, one byte for each major color component. A true colour, or 24-bit color system uses all three bytes. However, many color display systems use only one byte, limiting the display to 256 different colors.
Each colour of an image is stored as a binary number and the colour depth of an image is measured in bits. The number of bits indicates how many colours are available for each pixel. In a black and white image, only two colours are needed. This means it has a colour depth of 1 bit. A 2-bit colour depth would allow four different values: 00, 01, 10, 11. This would allow for a range of colours such as:
Binary Code Colour
00 White
01 Light grey
10 Dark grey
11 Black
The greater the colour depth (bits per pixel), the more colours are available as shown in the table (right).
To determine the best size for images online, the content width should be considered. The default content area dimensions for an image in my Weebly is 2000x1333. There would therefore be no need to use images more than 1333 pixels wide as any image large than this will automatically be shrunk when shown on screen. The file size of an image is another factor to consider. Although the PPI does not affect file size, the pixel size will. As an example, an image at 600 pixels wide x 400 pixels in height will have 240 000 pixels of information and an image of 800x600 will have 480 000 pixels of information and therefore contains more data so will be a larger file. The larger the file the slower the page load time. Images used on the web can be much smaller in resolution and file format to allow for quick upload. Therefore, when considering the working file size of an image it is not enough to just state the resolution or image size by itself. Both resolution and image size need to be used together.
In the Australian Curriculum’s Digital Technologies Knowledge and Understanding strand, F-2 students are required to be able to recognise and explore patterns in data and represent data as pictures, symbols and diagrams (ACTDIK002). An elaboration of this states that students learn how data is represented by changing pixel density (resolution) in a photograph with support and noting the change in file size to successfully email to a friend. To support this learning outcome in the classroom, it is necessary to understand that digital technologies are not just about using technology for teaching. Instead, a digital pedagogy must be considered to use digital technology tools thoughtfully and maximise the impact of digital tools on learning. The effective integration of technology across learning areas will enable students to learn how to best use technology at a point of need for an authentic purpose. Teachers therefore need to give students time to explore the use of technology tools and time to communicate their discoveries in an authentic context. This quote by Michael Fullan, a leading change expert really resonates with me, “Pedagogy is the driver, technology is the accelerator.”
Leading to the learning outcome, student knowledge of pixels can be developed through teaching-learning activities such as:
- Using a pixel art image, students react and explain what they see. Pixel art images selected should be within student interests.
- Various colour by number activities can be done by the students.
- There are many iPad apps available that students can use to play pixel games and solve pixel puzzles.
- Explore photographs and images to demonstrate that computers store this data using pixels. Students can explore different sizes of photographs and images and discover what happens when an image is resized using simple editing software such as MS Paint. Discussion can include questioning such as, how does the photograph change? What differences are there in images that have been resized?
|
|
|
|
Student knowledge about emailing must also be developed. After discussion about the different ways people can send messages to each other, the teacher can demonstrate how email is used to communicate with real people within their school. Once students have observed an email exchange, they can participate in imaginative role-play to envision how messages are transmitted by email.
To achieve the learning outcome the teacher could consider the following:
- Use of a metaphor to engage students in a whole class discussion about efficiency. Comparing the sending of an image by email using a computer to the posting of a small toy can help students to understand the flow of efficiency when sending information. As an example, a big postage bag would not be used to post a small toy because it will cost more money, makes more work for the postal services and takes longer to receive. It's just not efficient. In the same way, sending a very large file image by email will take much longer and be less efficient as sending the same image as a smaller file.
- Work with students to attach different sized images to an email and use a timer to calculate the time it takes for the image to upload and attach to the email. This was done using different sizes of the apple image and the upload and attach times were calculated as follows:
- 88x88 Apple - 2.37 Seconds
- 300x300 Apple - 3.97 Seconds
- 800x800 Apple - 5.05 Seconds
- 1500x1500 Apple - 6.71 Seconds
This activity then provides an opportunity to link learning to the content description, collect, explore and sort data, and use digital systems to present data creatively (ACTDIP003) of the Processes and Production Skills strand of the Digital Technologies F-2 curriculum. This content description requires students to explore and creating graphs to represent classroom data. Using the data collected on the time it takes to download and attached different sized images to an email, a table and line graph can be created in Excel so that students can see a visual pattern.
References
Australian Assessment and Reporting Authority (ACARA). 2017. Digital Technologies. F-10 Curriculum. Retrieved from http://www.australiancurriculum.edu.au/technologies/digital-technologies/curriculum/f-10?layout=1
Bradley, H. 2006-2017. Image Size and Resolution Explained for Print and Onscreen. Retrieved from https://digital-photography-school.com/image-size-and-resolution-explained-for-print-and-onscreen/
Loiseau, A. 2017. Learning Design for: What About Pixels? Retrieved from http://www.allyouneediscode.eu/documents/12411/69843/Lesson+plan+6_+What+about+pixels.pdf/34376d2d-93b5-4507-a7a7-d9b519f85ecd
